

COLUMBUS — These are the college football stat sites we talked about on the Wednesday show. We wanted to put the links in one spot without messing up the podcast description on that post itself.
So here they are.
SP+
From Bill Connelly, who created the formula and was hired by ESPN in 2019. He updates his ratings every week, and your best bet is to search SP+ and Bill Connelly until the new rankings pop up. This week, Ohio State is No. 2 overall team and third in offense and second in defense.
Past SP+ ratings are good for comparing the Buckeyes against themselves.
Here are
Fremeau Index
It’s a measure of a team’s success drive to drive that we cite regularly. It goes back to the 2007 season. Find it at bcftoys.com, where the Buckeyes are No. 3 this week.
Game On Paper
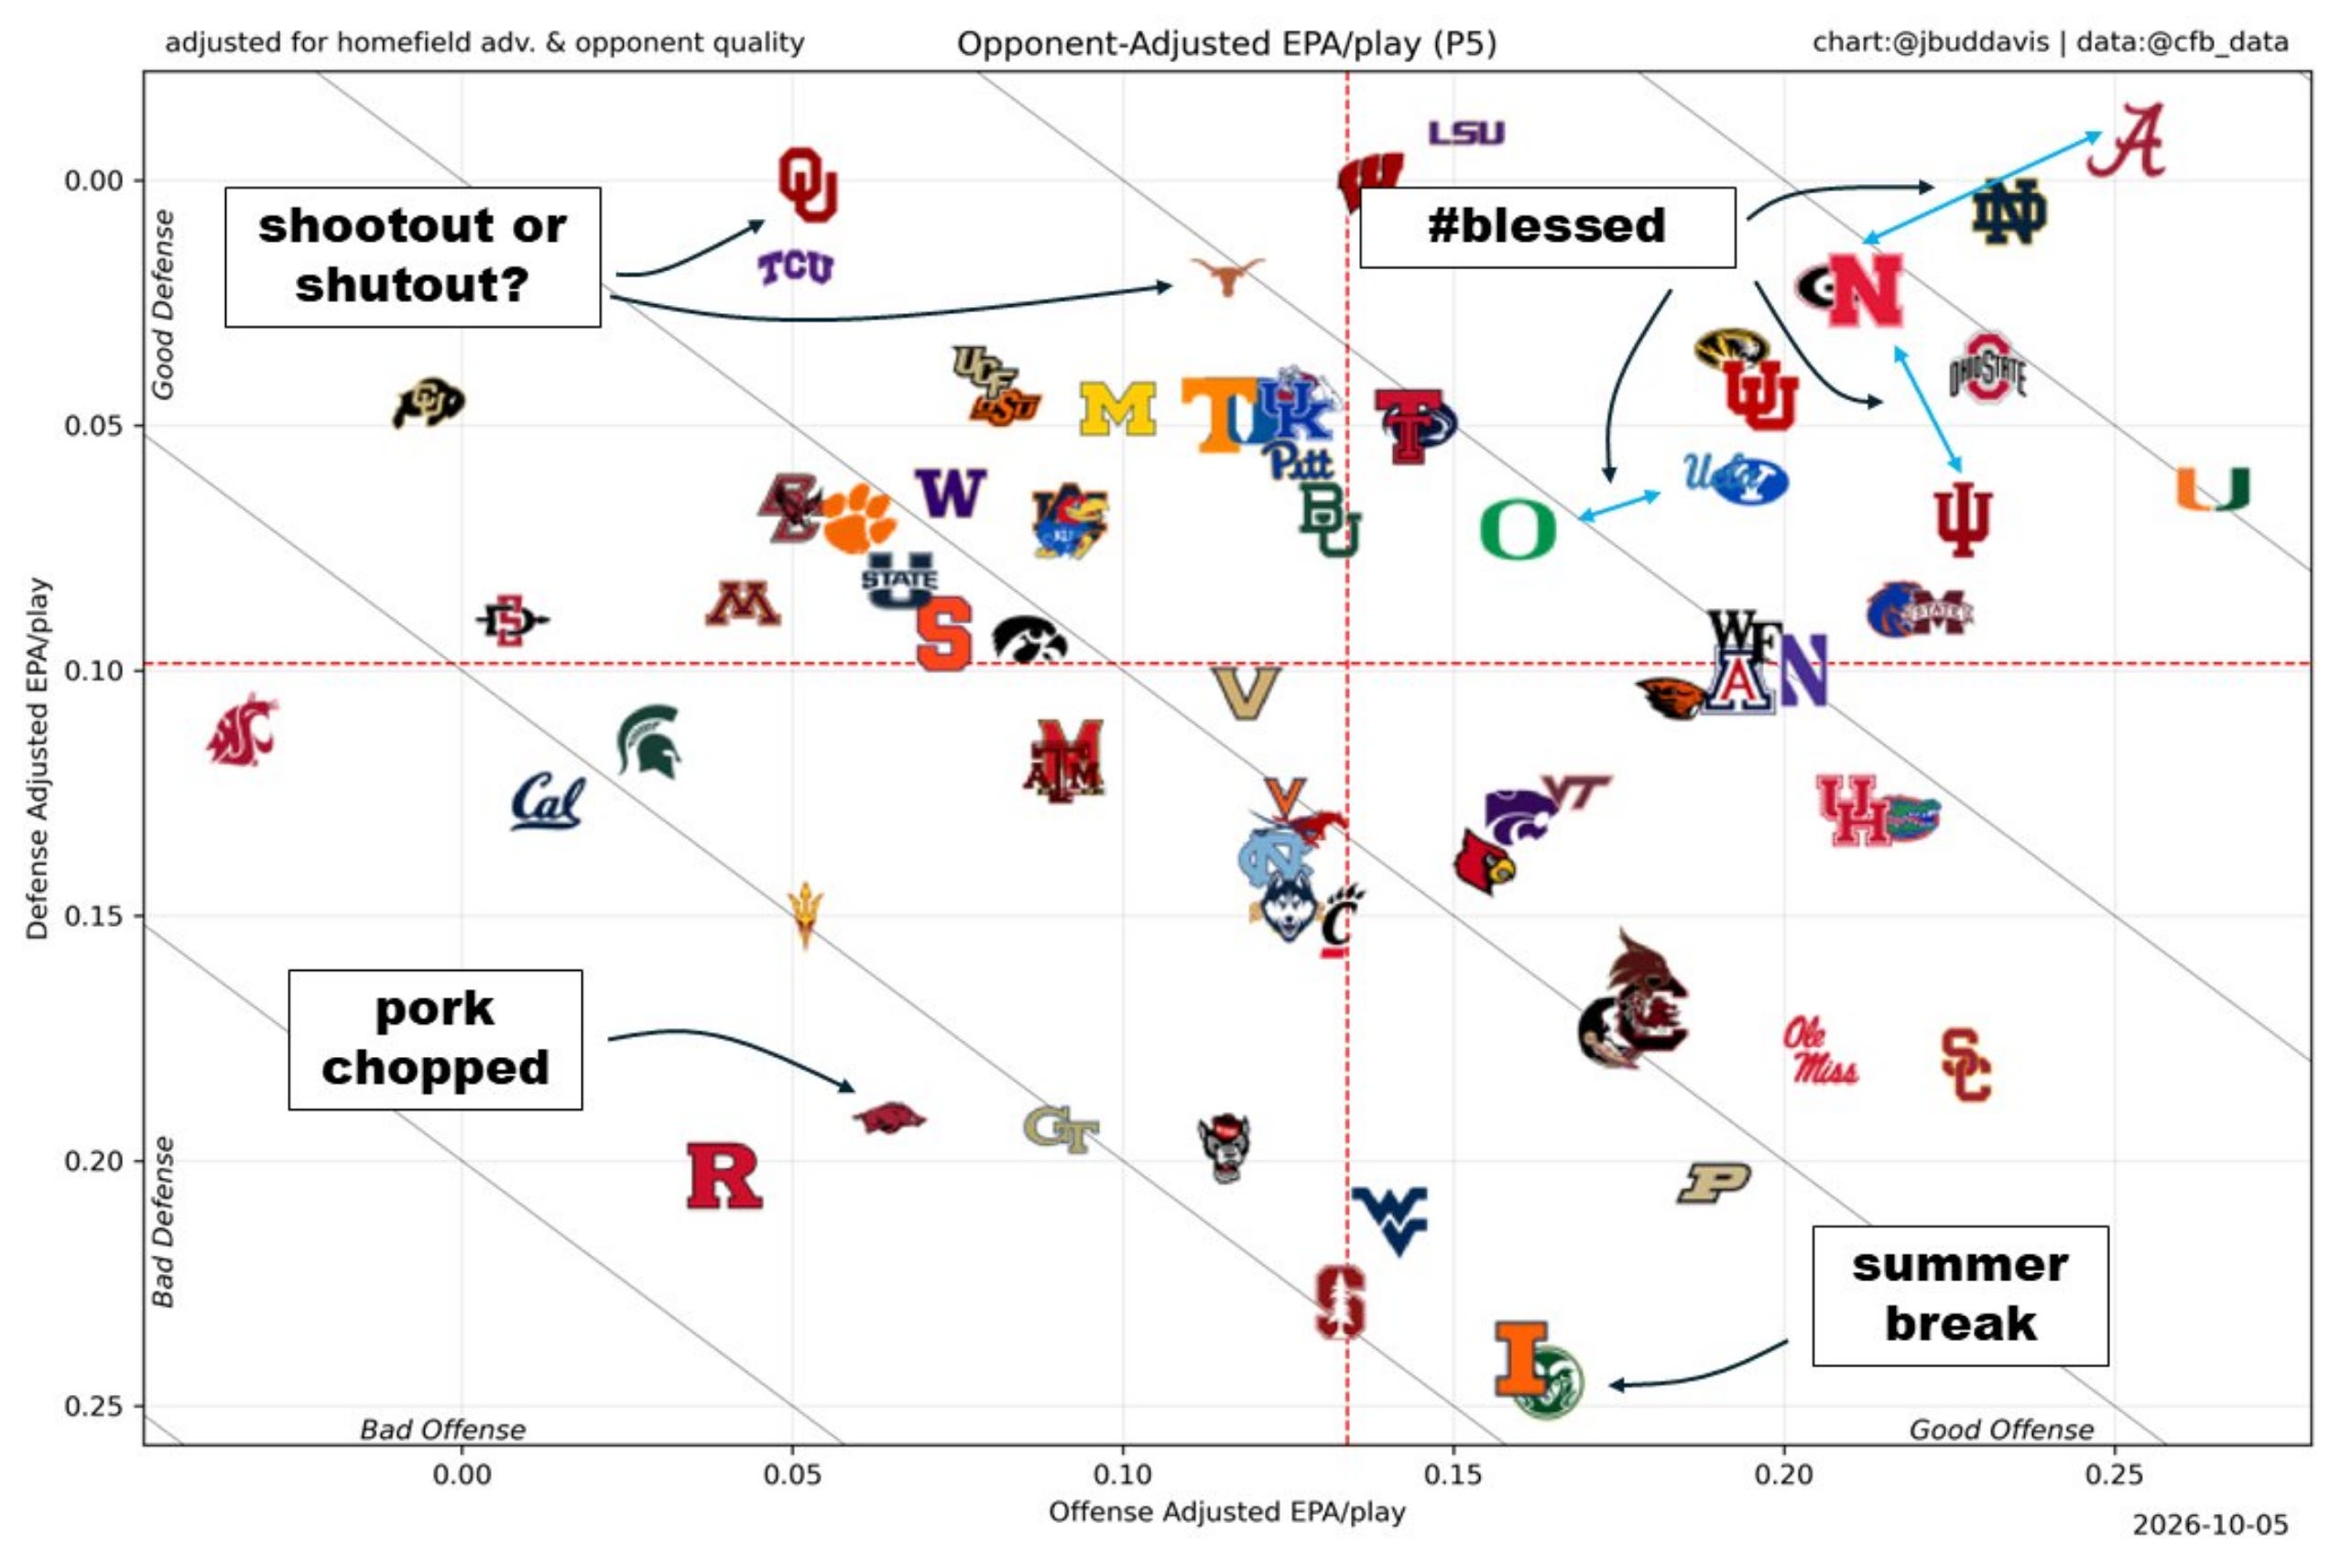
A good site for Adjusted EPA per play, which is a measure of overall play-to-play success. This link takes you straight to the 2026 season page. Ohio State is No. 5 overall, No. 9 in offense and No. 15 in defense. You can also look at player EPA per play, where Jeremiah Smith is No. 1 in receiving, Julian Sayin is No. 2 in passing, and Ja’Kobi Jackson is No. 40 in rushing.
CFBStats.com
The best site for standard stats, some of which are really important and easy to decipher. There is yards per game and points per game, but we really look at third-down conversions on both sides of the ball, red-zone conversions (TD rate is what matters) and long scrimmage plays. I’m on this every day.
CollegeFootballData.com
This is really good for the more advanced stats, but you have to work a little to get there. From the main page, click on
Analytics
at the top.
Then choose
CFB Data Exporter.
Scroll down to the bottom left corner of the page and find the header
Stats
Under it, click on
Returns Advanced Team Statistics Aggregated by Season
That will take you, hopefully, to this page, which means you can skip those steps and click here.
From here, put in the year for the season you want (2026 for this season) and then type in the weeks you want covered. It would be Week 0 to Week 5 so far. Also check the box to exclude garbage time.
Hit the green button labeled
Query
That should produce a database of many stats. If you click the Export button, you can create a a spreadsheet offsite to peruse at your leisure. Or you can stay on the site and click on the columns you want to sort.
For instance, Offense Success Rate is the do-your-job down-to-down stat we use a lot. It’s the seventh column, and the third stat listed. Sorting that, Ohio State is No. 5 behind Miami, Georgia, Notre Dame and Houston.
Defense Success Rate is another important stat — how often you allow opposing offenses to do their jobs. This is also the site we use to find Havoc Rate, which is listed as Defense Havoc Total. That measures how disruptive a defense is. This is another place we visit often, but it takes more time to find what you’re seeking.
Twitter Follows
All those sites are free. Many analytical college football experts also give their insights and charts away on Twitter.
@CFB_Data is creating charts each week based off the info at CollegeFootballData.com
@JBudDavis does cool charts each week that use the data to put teams in quadrants of success. It’s a nice visual.


@Statsowar does Advanced Stats Previews of all games each week, with a predicted score. He also created the popular How Bad Did We Get Beat chart which measures net success in each FBS game.


That’s just a start. We are far from experts when it comes to the statistical analysis of college football, but we do reference these stats a lot as we look for context on exactly where the Buckeyes fit in the big picture of college football.
I love this kinda stuff! Thanks guys!